CEED Diagnostic Services
The Aquatic Diagnostic Laboratory offers many different types of diagnostic assays for shellfish and finfish diseases.
We provide disease testing for all life stages larvae-adult of shellfish and finfish. The type of testing needed is dependent on the host species and pathogens of concern. Please see the descriptions of the diagnostic services offered and submission instructions.
Please contact us to receive official quotes and to set up a time to submit samples.
Submission Forms
Please be sure to download, fill out and include this form with your animals.
Download a Fish Submission Form
Download a Bivalve Submission Form
Contact
Contact us with any additional questions and to set up a date and time for sample submission.
Email: gsharon@rwu.edu
Please call with any additional questions or concerns: Galit Sharon, DVM (401) 254-3299
Histopathology
Histopathology is a common diagnostic technique used in veterinary and human medicine, in which sections of tissues are examined microscopically.
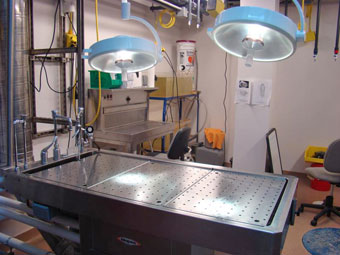
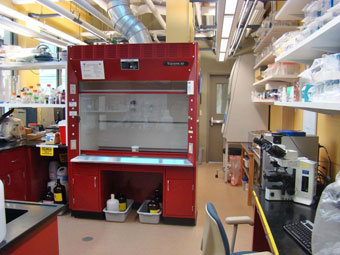
A brief overview of how tissues are processed for histopathological examination: After a gross examination a specimen is fixed with a fixative (we usually use 10% formalin) and after to 48 hours tissues are trimmed and embedded into paraffin wax. 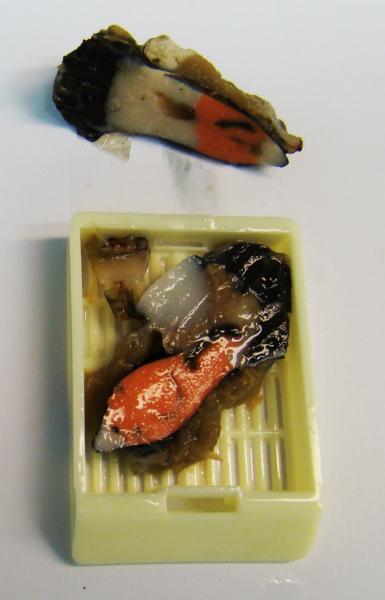 Very thin 5-6 µm sections are cut and placed on microscope slides. The paraffin is removed
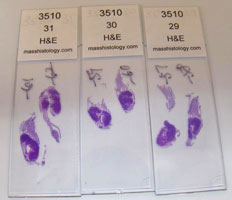 and the remaining tissue is stained for contrast and highlighting. The typically stain used for this process is hematoxylin and eosin (H&E). The hematoxylin (a “basic” dye) stains nuclei and nucleic acids blue and eosin (an “acidic dye) stains cytoplasm pink. Other stains are available and are dependent on other aspects of the testing that may be needed. By using histology for diagnostics we can not only look for pathogens within the host but also observe the normal or abnormal development of various tissues and cells in the animals of interest.
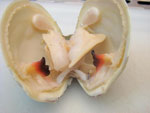
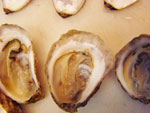
Left is a picture of a cross section cut through a bay scallop, Argopecten irradians ready to be processed into a histology slide. Right is a picture of Eastern oyster, Crassostrea virginica sections made into H&E slides after embedding into paraffin wax.
Insert more histology slides here.
Traditional Dermo Assay
Traditional dermo assay was developed by Ray (1952)6 and is used to detect a common parasite of shellfish called Perkinsus marinus. This method is often referred to as the RFTM Assay or Ray’s Fluid Thioglycollate Medium Assay. The process involves removing pieces of mantle and rectum tissue to oysters (aseptically) and incubating these tissues in sterile RFTM (culture media) for 5-7days. Over this incubation period the trophozoites of P. marinus present in the tissues, form hypnospores with thick cells walls (Smolowitz, 2013)7. Please see section on Perkinsus marinus life cycle and epidemiology (anchor link to dermo) After incubation tissues are removed from the media, stained with iodine and visualized under a light microscope. The black stained cell walls of the hypnospores can be counted and an estimation of the intensity of dermo infection using the Mackin scale can be determined (Howard et al, 1994)2.
Table 5. Mackin Index used to score RFTM tubes
Mackin Rating
Estimated Number of Hypnospores
0
No hypnospores observed
0.5
1-10
1
10-100
2
100+, small groups of spores ( 25-50 in each grouping), plenty of tissue visible
3
Many spores throughout all tissue, 25-50%?coverage of spores, tissue stains slightly blue/black macroscopically
4
Majority of tissue has spores, tissue blue/black macroscopically
5
Hypnospores encompassing all tissue, often in layers in tissue.Tissue stains very blue/black macroscopically
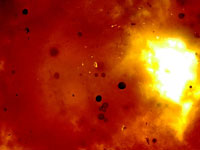
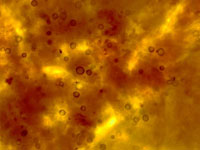
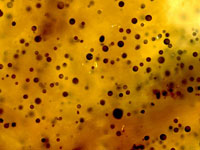
From left to right: Pictures of oyster tissue after incubation in RFTM stained with Lugol's iodine. Mackin ratings of 2, 3 and 4.
Polymerase Chain Reaction (PCR)
Polymerase chain reaction (PCR) was developed in 1983 by Kary Mullis (Innis, M. et al.,1990)3. PCR is an essential component in many diagnostic laboratories. It’s a molecular method (DNA/RNA based) that utilizes the ability to copy DNA. Typically PCR begins with a very small amount of DNA (one or a few copies) which is then amplified over many orders of magnitude to create millions-billions of copies of the same sequence of DNA (Innis, M. et al.,1999)4. There are many uses for PCR, including disease diagnostics, analysis of gene expression, DNA cloning, sequencing, DNA-based phylogeny, forensic science and genotyping.
The mechanism behind PCR is a complex and is reliant on polymerase to synthesize a new strand of DNA exactly similar to the original. The polymerase is an enzyme that catalyzes the synthesis of DNA replication with the assay. The polymerase will add free nucleotides to the 3’ end of a newly forming strand of DNA. This action is reliant on a primer specific to the gene region of interest. The primers bind to the specific site on the single strand of DNA complementary to it and the polymerase then attaches to the primer, utilized free nucleic acids and forms a new double stand of DNA exactly the same as the target. This process is typically three steps that repeat 30-40 times at specific temperature that promote the 3 main mechanisms of PCR; denature anneal and extend. This is also referred to as the thermal cycling protocol.
 During the initial stage of Denaturing the double stranded DNA is heated to 95°C so that it melts and comes apart into two single strands of DNA. This step can be as short as 30 seconds or as long as 2 minutes.
Then the DNA is cooled to the annealing temperature which allows the primers to anneal to the specific locations on the sequence. The annealing temperature is specific to the set of primers being used and typically ranges from 50 to 65°C and 30-60 seconds.
After this the DNA is then warmed again for the extension step. The polymerase binds to the primers on the DNA and elongates new section forming a double stranded piece of DNA that is the target sequence. The extension temperature is typically 72°C and can range from 1-2 minutes. Now one full cycle is complete. This process will repeat 30-40 more times, creating million-billions of copies of the target sequence. (Schematic of PCR steps from 9: http://users.ugent.be/~avierstr/principles/pcr.html
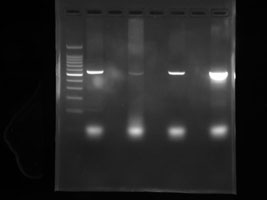 After the process is complete the “product” is run on a gel electrophoresis machine to determine if the target sequence was truly amplified. Gels must first be stained with a fluorescent tag/nucleic acid stain that will allow the “band” of PCR product to glow under UV light. The bands are accessed for molecular weight to determine if the PCR reaction was successful.
Right Picture: Example of PCR product run on an electrophoresis machine. Gel was stained with fluorescent dye and the picture was taken under UV illumination.
Quantitative Polymerase Chain Reaction (qPCR)
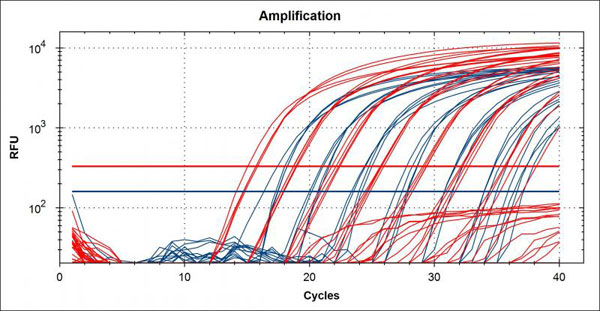
Quantitative Polymerase Chain Reaction (qPCR) is often called real-time PCR because the PCR reaction is simultaneously amplified and quantified during the assay. As the cycles of traditional PCR are carried out (denature, anneal, extend) the amount of target sequences being amplified is determined with the use of a fluorescent probe. An increase in the fluorescent signal is direct proportion to the amount of PCR product being generated (Arya et al., 20051 and http://www.ncbi.nlm.nih.gov/projects/genome/probe/doc/TechQPCR.shtml8. Fluorescent probes are dye molecules that either attach to primer or probes hybridizing to PCR product thought the assay (TaqMan assay) or double-stranded DNA (dsDNA) binding dyes (SYBR green assay). As the polymerase extends the primers upstream of the probe it will cleave the probe, releasing fragments of reporter dye into the matrix of the tube. This release of reporter dye is what can be measured in the assay. Regardless of the type of “probe” used the amount if signal given off is measured at each cycle through the PCR and a “threshold cycle” (Ct) or “quantification cycle” (Cq) is given to each sample. The threshold cycle is determined based on the threshold of the assay, where the fluorescent signal crosses over the baseline signal indicating a relevant signal is higher than the background signal (Life Technologies 2012)5. The threshold cycle has an inverse relationship to the quantity of DNA in the sample, with low Ct/Cq values equating to large amounts of target DNA and high Ct values equating to low template quantities. See image of a typical amplification plot below.
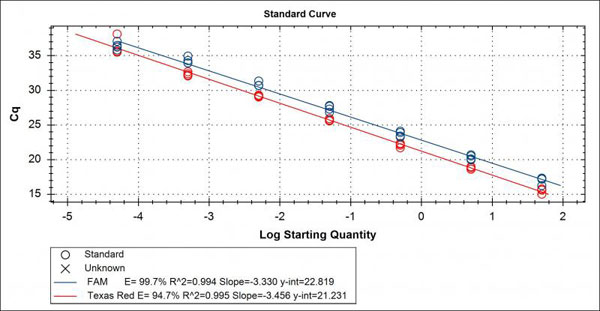
Quantitative PCR always utilizes a standard curve of known concentrations as positive controls in the assay to help equate “unknowns” to known amounts of DNA or copy numbers. This standard curve is specific to target DNA of the test and is typically a 10-fold dilution series over seven to eight orders or magnitude. The standard curve will generate a linear line in an optimized assay with a R2 value of 0.999 to 1, known as the correlation coefficient. In addition, the standard curve will also indicate the efficiency of the assay. An optimized assay will have an efficiency of 90-110%, with 100% indicating a slope of -3.32 for the linear regression line (See image of a typical standard curve plot below). Another way to interpret the efficiency is that at 100% the template is doubling after each thermal cycle.
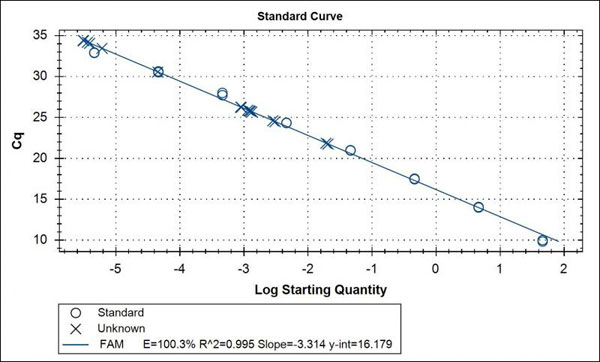
It is from this data from the standard curve of know quantities that the absolute quantification of “unknown” samples can be determined. See image of a standard curve with unknowns (X) below.
Gross/Clinical Observations
Every animal(s) submitted to the ADL is first necropsied and clinical observations about the overall health of the animal or group of animals is recorded. The type of necropsy performed is depended on the species submitted.
Shellfish: For shellfish, a sub-set will be measured for an estimate of average length (mm), width (mm), height (mm) and mass (g), then all animals will be aseptically shucked and the overall gross condition of “meats” will be assessed. Any obviously thin and watery meats will be recorded along with any animals discolored tissues. The amount and types of fouling organisms on and inside the animals will also be determined.
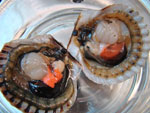
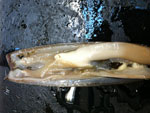
From left to right: Quahog, Mercenaria mercenaria; Eastern oyster, Crassostrea virginica; Bay scallop, Argopecten irradians and Razor (jackknife) clam, Ensis directus all necropsied in the ADL.
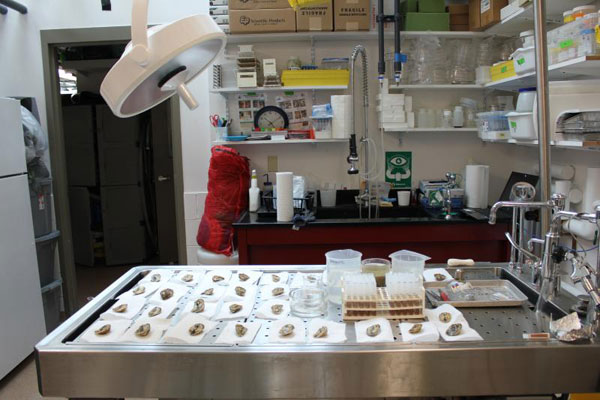
Finfish: For finfish submission it will greatly depend on how the animal is submitted, live or dead. Live animals with be either anesthetized or euthanized with an overdose of Tricaine methanesulfonate (MS 222), (depending on the submitters wishes). Initial external observations will be recorded in relation to fin quality, skin quality, eye clarity and size, and overall appearance of the animal. Once the initial observations are complete a skin scrape, and gill clip will be performed to check for external parasites. This procedure can be done for anesthetized fish or euthanized fish. If the fish has been euthanized it will then be necropsied and internal organs will be examined for any abnormalities. Histological evaluation of tissues will be conducted if requested by the submitter.
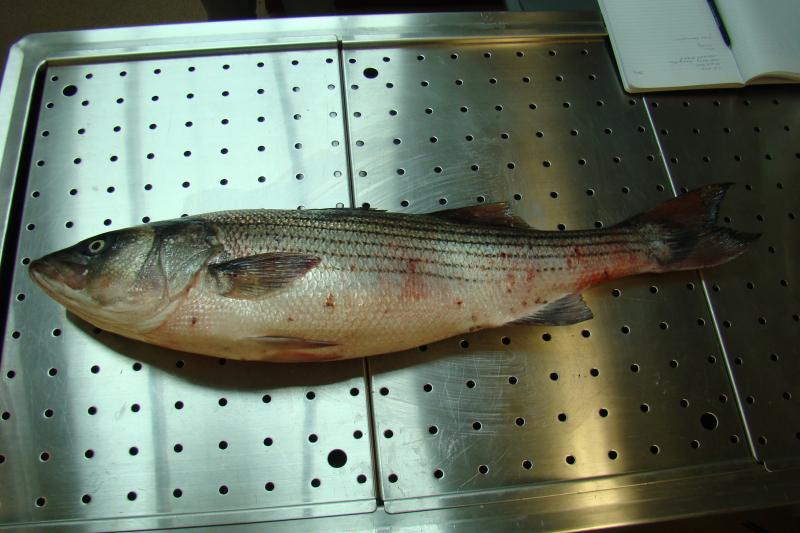
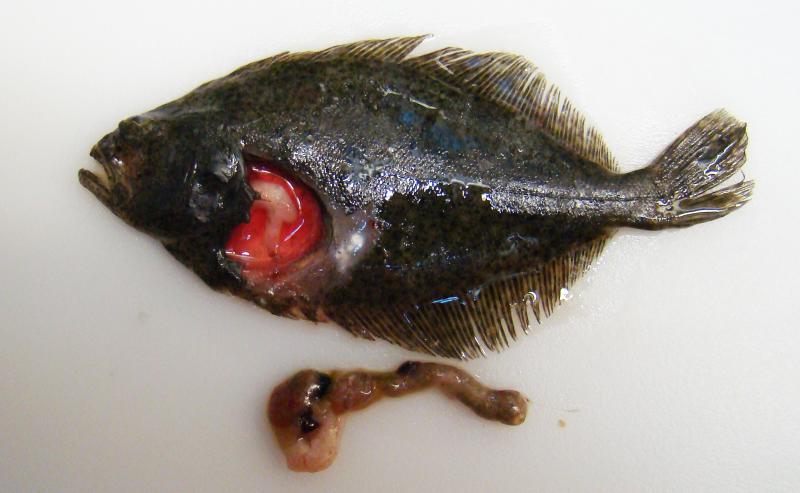
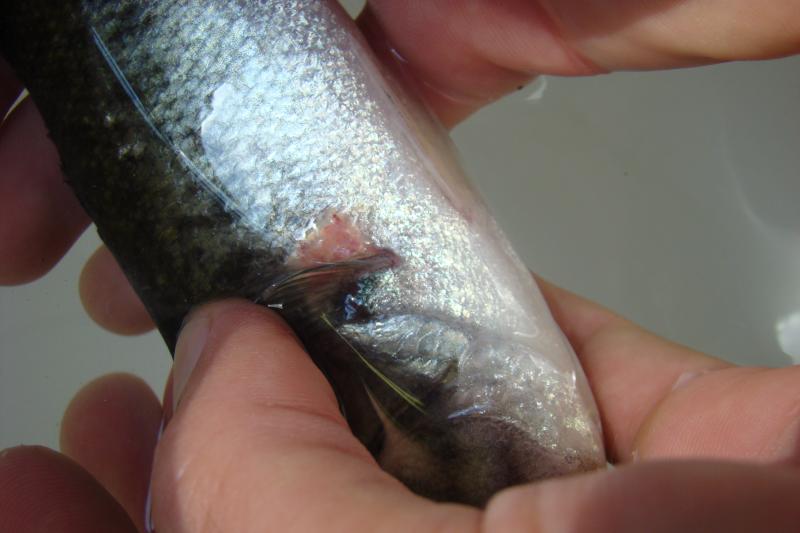
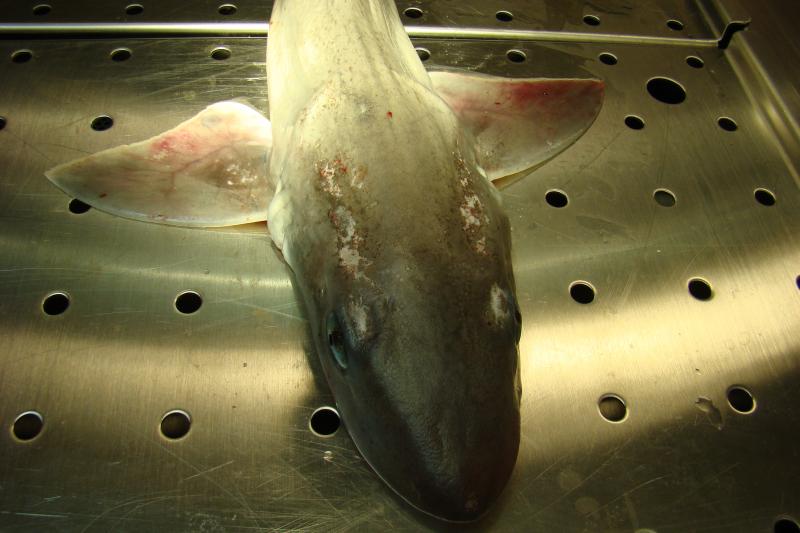
From left to right: Striped bass, Morone saxatilis; Summer flounder, Paralichthys dentatus; Large mouth bass, Micropterus salmoides; Smooth dogfish, Mustelus canis all necropsied in the ADL.
Submission Instructions
Why am I submitting samples for diagnostic testing?
- Disease Diagnosis/Outbreak
- Health Examination for movement or for general health assessment
How do I know what size animals to submit?
- Number of animals submitted depends on the size of the animals and the reason for submission (disease diagnosis vs health examination)
- If the animals are on average less than1 ½ inch (4 cm) in shell height, then submit slightly more than twice the number to be examined (130 or 55live animals)
- If the animals average over 1 ½ inch (4 cm) in shell height, then submit just slightly more than the number to be examined (65/30 live animals)
- If very small seed is being submitted, talk with the diagnostician about sample size needed.
How do I know which of the animals in the population to submit?
- Haphazard/random collection- Used for health examinations. Animals collected without a directed plan. Want an unbiased representation of the population.
- Hard clams, should all be sampled from the animals in the plot without regard to where in, or on the surface of the plot the animal is found
- Oysters and other bivalves contained should be selected from several of the bags/upwellers in which the population is being held/grown.
- Non-random (directed sampling)-usually used when there are disease outbreaks. **Please talk with the diagnostician before submitting these samples – the diagnostician may provide specific instruction based on the problems you are having.**
How do I handle my animals after they have been collected?
- Animals should be cooled immediately after collection (not exposed to fresh or salt water!) and held in a thermally insulated container. – Do not put in water but do not let them dehydrate (do not put in a defrost refrigerator in a net bag).
- Bring (or ship) animals in a cooled state to the diagnostic laboratory within 24 hour (preferable 4-6 hours)—be aware of the seasonal temperatures in your areas and the temperature of the shipping trucks/planes.
- Animals are almost never submitted in a “fixed” state. Please contact the diagnostician before “fixing” any tissues.
***Remember—it takes time to get this work done- don’t wait till 2 weeks before you need results to contact a diagnostic laboratory – ideally you should contact the laboratory a minimum of 5 weeks ahead of the date your results are needed. At that time, a submission date will be scheduled for your samples.
Please Contact the ADL to set up a sample submission time or to request a special quote:
- phone: Galit Sharon at (401) 254-3299
- email: Galit Sharon at gsharon@rwu.edu
- PLEASE be sure to download, fill out and include the submission form with your animals. Download a submission form here.